ARE YOU A STORYTELLER? CREATE A MAP FOR YOUR STORY
If you see the long text without visuals, will you read that article or will you ignore it?
Visualization plays an important role today. Readers want to see the visualization. Especially for journalists and storytellers, it is more important. I want to explain three websites for creating maps and I want to explain how you can use maps for your project.
GOOGLE EARTH STUDIO
Before Google Earth Studio, maybe I should explain Google Earth. Google Earth is a map application developed by Google. It allows you to explore all the countries of the world through the world map. You can navigate around the world, click on a country and explore that country. You can navigate over countries in 2D and 3D. You can even see the streets of some cities thanks to the “Street View” feature. Google Earth is different from a classic map. The buildings, rivers, trees, and important historical places of the country/city are designed realistically and you can see them while navigating the map. Google Earth is a good example of an interactive map.
Google Earth Studio is an animation tool for creating animation maps. The data you see in Google Earth also appears in Google Earth Studio. But this time you can take a photo of this data or save it as a video. Google Earth Studio gives us this information for free. But you have to cite the source. That’s why you shouldn’t delete the “Google Earth” name in the video.
First, you need to register with Google Earth Studio. Google will ask you why you want to use this app and will usually accept your request within a day if it sees fit. It is an easy tool to learn. If you want to shoot a video on the map, you have to navigate over the map. If you want to go to a specific place, you can click on the magnifying glass icon and write the address you want to go to. You can change the view of the map. Generally, I prefer “exploration maps”.
If you want, you can also create the moon and Mars animation. But you can see just the moon and Mars’s surface.
When you finish your video, you can convert it to MP4. When you save your video, your video will be saved in the cloud of Google Earth. You should download it from the cloud.
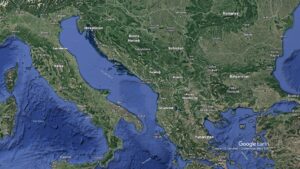
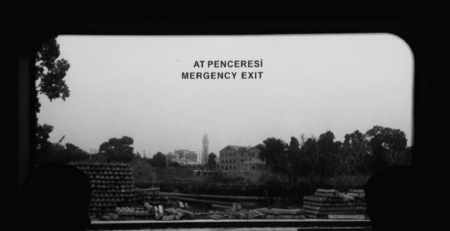
This photo was taken by Google Earth Studio.
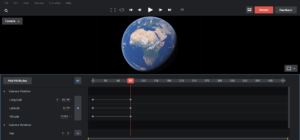
Google Earth Studio Interface
KNIGHT LAB
Knight Lab was created by the community of Northwestern University Knight Lab. There are designers, developers, students, and educators in this community. They created tools for storytelling. They have six tools for now: Storyline JS, Storymap JS, Juxtapose, Soundcite, Timeline and Scene VR. If you have a story and you want to try new things, these tools are great for you. These tools are so useful, especially for journalists. Because your story can be interesting but for readers, it is not enough. Also, readers want to see creative visuals.
My favourite map is StoryMap JS. Thanks to this tool, you can create a map and you can add your text. So, readers can read your text, navigate the location and see photos. You can choose your map style, add images, and specify your location. Knight Lab recommends short stories, for example, a maximum of 20 slides.
Another useful tool is Storyline JS. If you have data and want to explain your story by specifying the years, you can use this tool. If you want to create a timeline, Knight Lab also has the Timeline tool. If you want to compare two photos and show the before and after of something, you can use Juxtapose. Also, you can create GIFs for your social media account owing to it. If you want to create VR (Virtual Reality), you can use Scene VR. You should use panoramic photos. First, you should log in to your Google Account. After log in, you can choose your title and description and add your photos. When you finish, you can get your VR embed link. The last tool is Soundcite. Honestly, I haven’t used it before. But if you want to add music to your text, you can use this tool. I think the idea is creative. Because voice can make your text more effective. Another good thing is in Knight Lab, they give examples of news from another newspaper. If you don’t have an idea about how you can use this tool, you can visit the Knight Lab website and you can check it out. You can see a lot of news from the Washington Post, The Times and more!
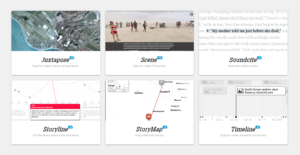
Knight Lab Projects.
DATAWRAPPER
Datawrapper is not just for mapping. Also, you can create charts and tables. You can use it for data visualization. For charts and tables, you can upload your data as an XLS/CVS; you can use a link from Google Sheets or you can write your data manually. After data, you can visualize your data and choose your chart type. For mapping, Datawrapper has three types of maps. Choropleth, Symbol and Locator.
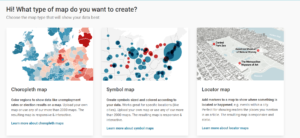
Datawrapper Maps Interface
*I joined the “Maps for Journalists” workshop and Mesut Ersöz, who is a Motion Graphics Designer in the BBC, explained to us Google Earth Studio and Datawrapper. Inspired by the workshop, I decided to write this article. Thanks to the Journalists Union of Turkey Academy and Mesut Ersöz.
Writer: Evin Arslan


Odgovori